How to debug ESP32S3 DevKitC-1 using built in JTAG with PlatformIO and VS Code
The story of two USB Type-C connectors
Recently, I got an ESP32S3 DevKitC1 and what stood out immediately was that it has two USB ports. At first, I was afraid, I was petrified, Kept thinking I could never figure this thing out. But, I grew strong And we learned how to get along.
So I survived my first encounter with two port ESP32S3 DevKitC1.
The ESP32-S3 DevKitC1 features two USB ports. The primary purpose of these two USB ports is:
USB-to-UART Bridge (USB Type-C): This USB port is primarily used for programming and debugging the ESP32-S3 SoC. It serves as an interface between the development board and a computer, allowing users to upload firmware and establish serial communication with the device for monitoring and debugging purposes. The USB-to-UART bridge is what hobby embedded programmers used since, like ever.
USB OTG (USB Type-C): The second USB port provides support for USB On-The-Go (OTG) functionality. This feature enables the ESP32-S3 DevKitC1 to act as a USB host or device, allowing it to communicate with other USB devices such as keyboards, mice, storage devices, or even other microcontrollers. The USB OTG support opens up new possibilities for developers, as it can be used in various applications like Human Machine Interface (HMI) systems, data logging, or even to interface with custom USB peripherals. It is also used for power supply to the board, and can also be used for flashing applications to the chip. What is also present here is access to ESP32S3 built-in JTAG for debugging. And that’s the part I was aiming to enable.
JTAG (Joint Test Action Group) was developed in the 1980s and has become an industry-standard protocol and interface for testing, debugging, and programming integrated circuits (ICs) and printed circuit board (PCB) assemblies. The last part, that ESP32S3 has built-in JTAG is what is impressive. No more need for bulky and octopus-like wire connections.
But the process to get it to work was a hassle, but in the end, it turned out to be simple, I just overcomplicated it.
The first step is to RTFM. For built-in JTAG to work, we first need to install the driver by running the following command in PowerShell. Note that you will first need to install ESP-IDF.
Invoke-WebRequest 'https://dl.espressif.com/dl/idf-env/idf-env.exe' -OutFile .\idf-env.exe; .\idf-env.exe driver install --espressif
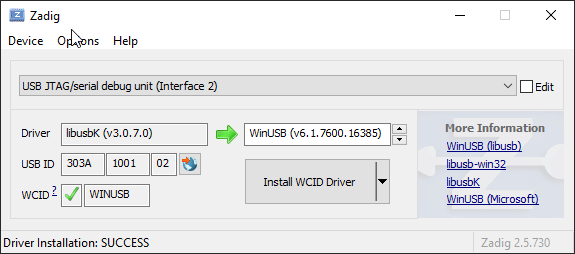
The next part was the one where I got stuck as there was not a lot of help to be found on the internet about why the debugging was not working. As it turned out I needed to use Zadig to change the driver of USB JTAG (Interface 2) to WinUSB from whatever it was before it. I tried libusbK but that did not work. Once Zadig starts up go to Options and List all devices, select USB JTAG (Interface 2), and select WinUSB as a driver. Then install, and wait a bit for everything to finish.
Next, in PlatformIO, or where ever you keep your build options add debug_tool = esp-builtin
Now you can set up breakpoints and debug the code from, for eg. VS Code with PlatformIO.
One additional nifty thing you can do is upload the code while having the Serial monitor open. To do that you will need to add
upload_port = COM13 ; <-- USB cable to board's UART
monitor_port = COM13 ; <-- USB cable to board's UART
to your platformio.ini file. Change the port to the one on your system.
Hope this helps someone!


Wonderful Solution!. I had hardtime to solve JTAG Debugging in platformio. I tried many methods in internet. This method is so easy so simple. Thank you. not use ESP-IDF driver install
Very helpful, thank you!